
Deal analytics summary
Track deal revenue, conversion, and sales trends in Bitrix24
Gratis
-
Evaluación
-
Instalaciones12237
-
DesarrolladorAlaio, inc
Descripción
Deal Analytics helps sales managers monitor pipeline performance across time, not just point-in-time totals. It connects to the crm_deal table and shows revenue movement, conversion rates, and average deal size — filtered by period, pipeline, and grouping dimension.
Why businesses use it
Sales managers need more than closed-deal totals. They need to see whether revenue is trending up, how long deals take to close, and how won and lost deals are distributed — without building reports manually.
Business value
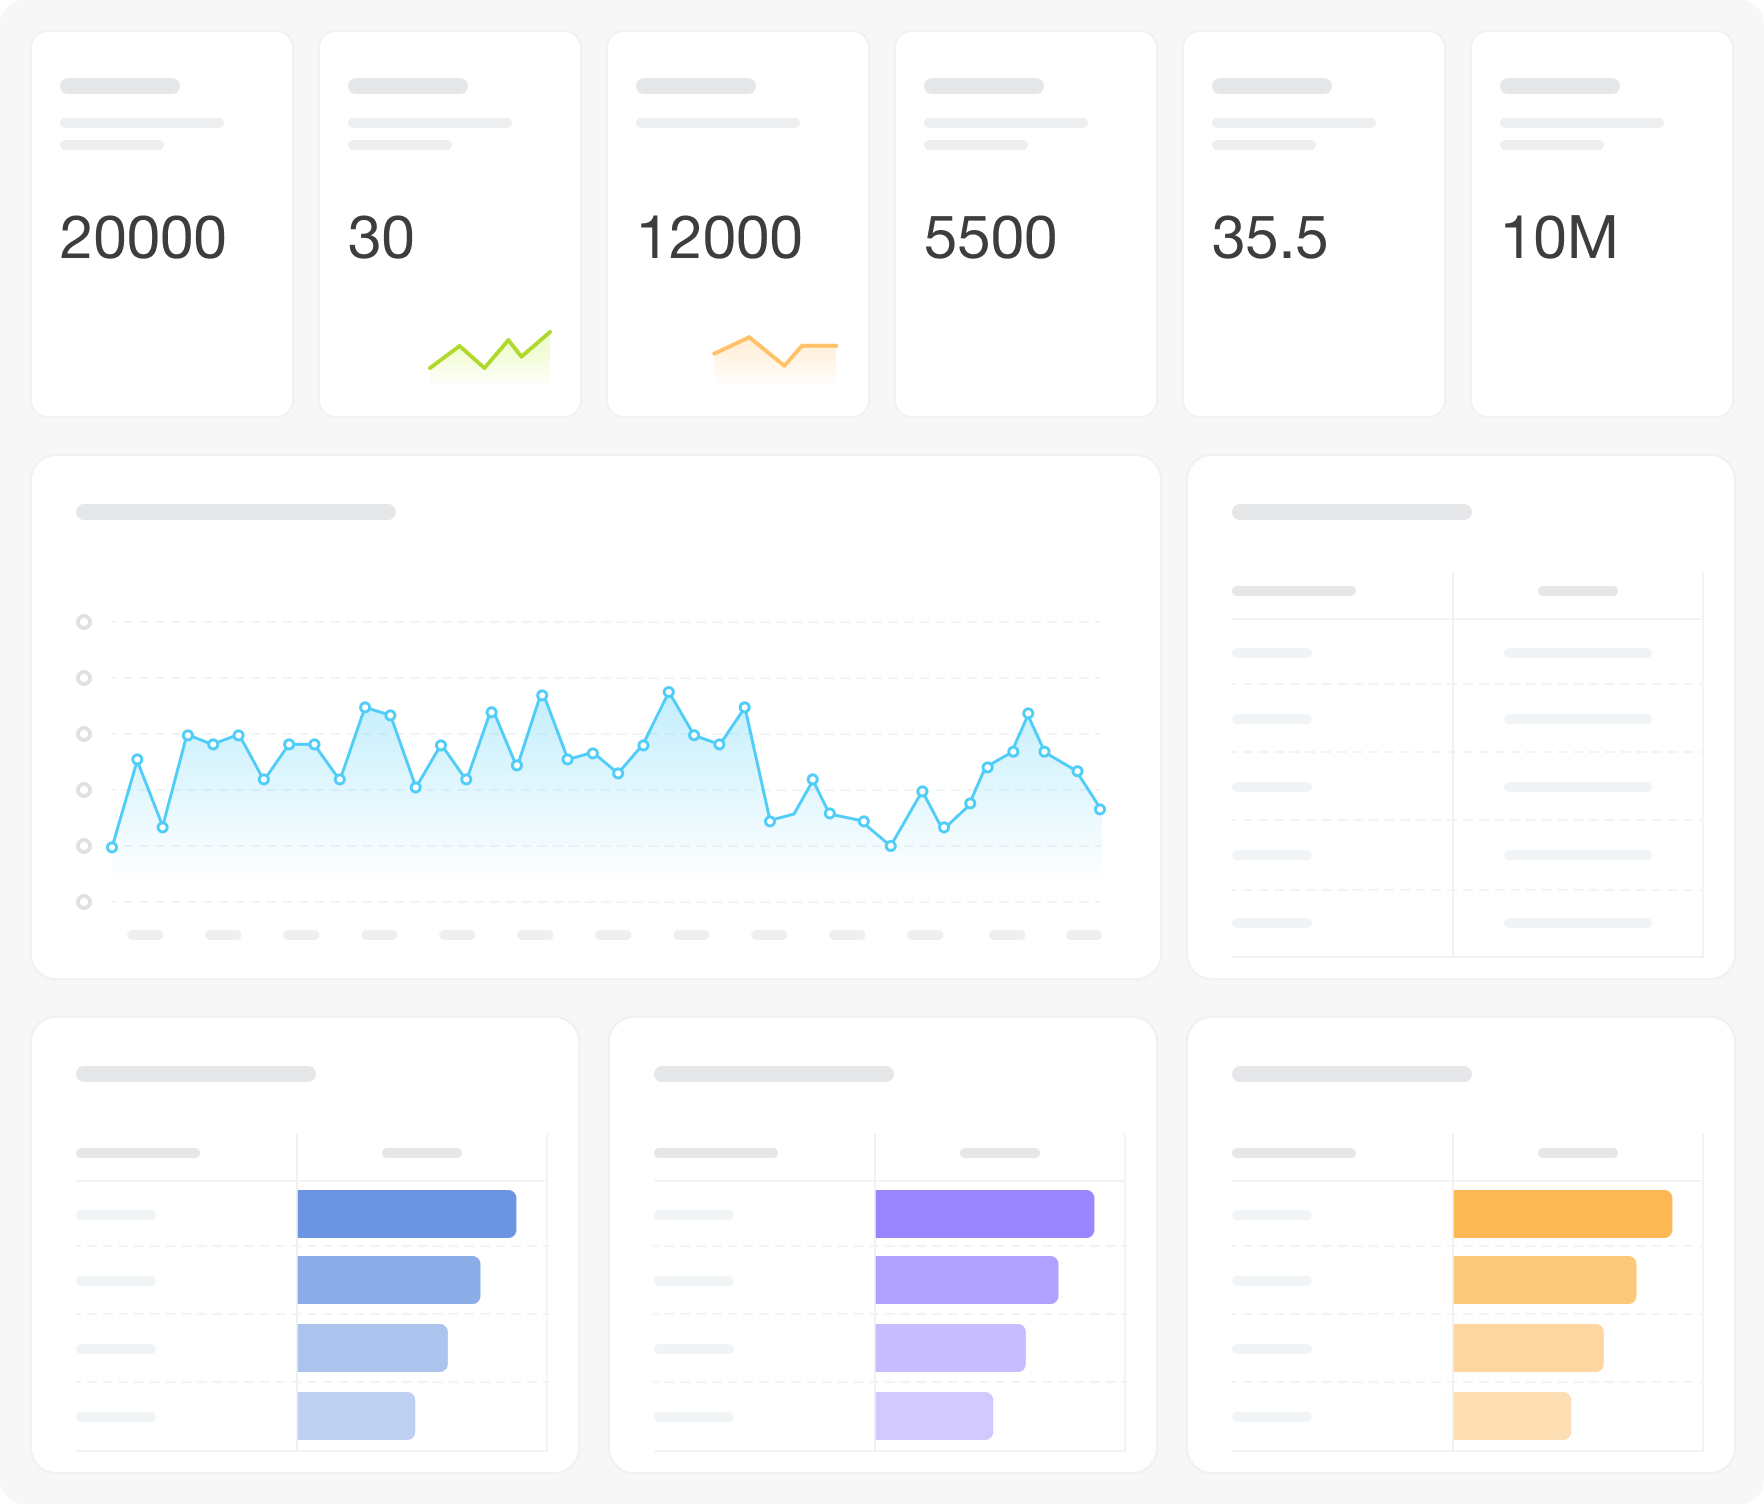
Install the app fr om Bitrix24.Market. The dashboard connects to the crm_deal table via the Bitrix24 BI connector. Eight visualizations cover KPI cards (revenue, conversion, average close time), a mixed chart of deal counts by status with conversion overlay, three line charts for revenue dynamics and year-over-year comparisons, and an average deal size trend line. Filters: Period, Grouping, Pipeline.
FAQ
Why businesses use it
Sales managers need more than closed-deal totals. They need to see whether revenue is trending up, how long deals take to close, and how won and lost deals are distributed — without building reports manually.
Business value
- Track revenue, conversion rate, and average deal cycle in a single dashboard
- Compare revenue year-over-year and on a cumulative basis
- Monitor deal counts by status group (in progress / won / lost) with conversion on a second axis
- Identify changes in average deal size over time
- Review weekly revenue trends and spot slowdowns early
- Compare this year's cumulative revenue to the previous year
- Check conversion rate movement across periods
- Filter results by a specific pipeline or grouping dimension
Install the app fr om Bitrix24.Market. The dashboard connects to the crm_deal table via the Bitrix24 BI connector. Eight visualizations cover KPI cards (revenue, conversion, average close time), a mixed chart of deal counts by status with conversion overlay, three line charts for revenue dynamics and year-over-year comparisons, and an average deal size trend line. Filters: Period, Grouping, Pipeline.
FAQ
- We see revenue totals in Bitrix24 reports, but can't tell if we're growing or declining month over month. Will this help?
- We don't know how long our deals actually take to close. Is there a way to track that?
- Our conversion rate dropped last month but we're not sure if it's a trend or a one-off. How do we check?
- What is needed to connect to Bitrix24?
Versión 4 · 03.07.2026
Historial

Historial de versiones
Versión 4
bug fixes
03.07.2026
Versión 3
bug fixes
27.03.2026
Versión 2
bug fixes
03.12.2025


