Sales trend
Identify seasonal sales patterns from Bitrix24 CRM data
Gratis
-
Evaluación
-
Instalaciones12900
-
DesarrolladorAlaio, inc
Descripción
Seasonal Sales Trends reveals recurring patterns in deal revenue and volume across periods. It is built for sales managers and analysts who need to understand how seasonality affects performance and plan resources or targets accordingly.
Why businesses use it
Sales cycles are rarely uniform. Managers need to see which months, quarters, or periods consistently produce more or fewer deals and higher or lower revenue — so they can forecast and plan with seasonal patterns in mind.
Business value
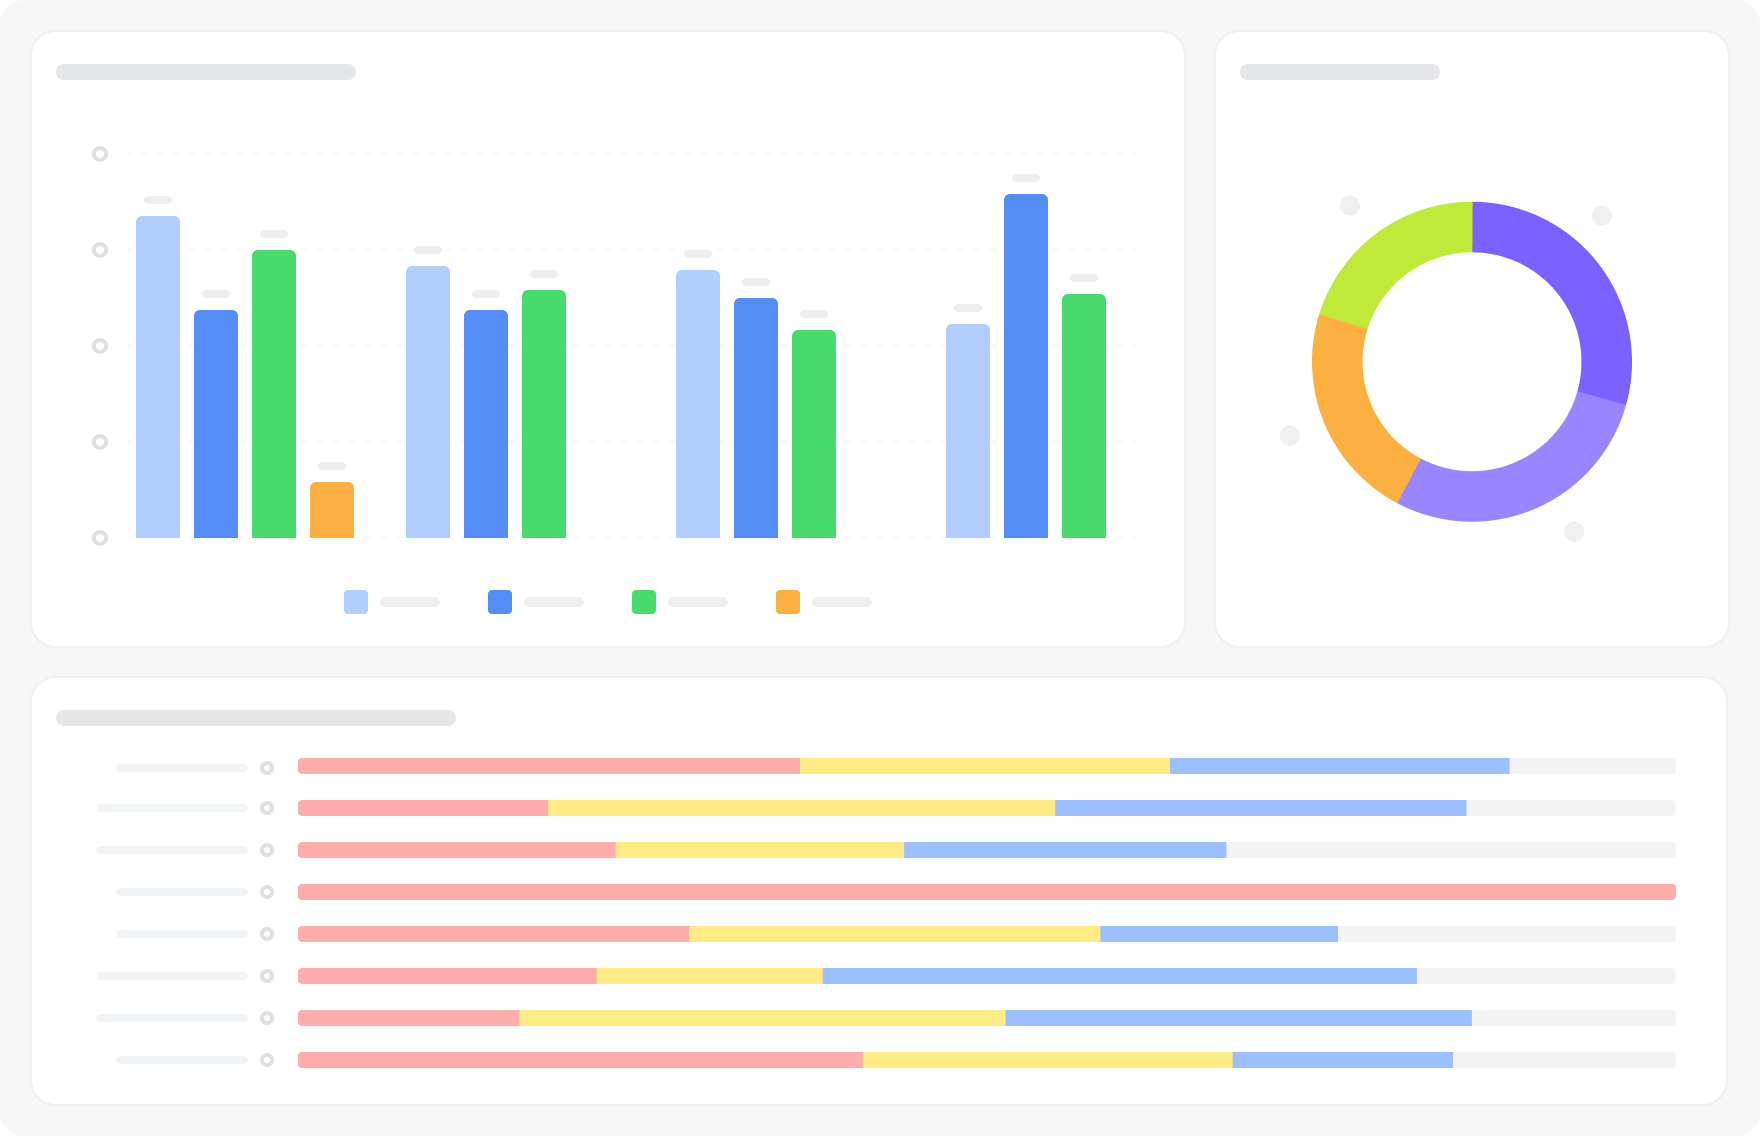
The dashboard connects to Bitrix24 deal data filtered by close date. Sixteen visualizations cover revenue and deal volume by period, year-over-year seasonal comparisons, and breakdowns by pipeline and responsible manager. Filters: Period (by close date), Pipeline, Responsible person.
FAQ
Why businesses use it
Sales cycles are rarely uniform. Managers need to see which months, quarters, or periods consistently produce more or fewer deals and higher or lower revenue — so they can forecast and plan with seasonal patterns in mind.
Business value
- Identify recurring high and low periods in deal revenue and volume
- Compare seasonal patterns year over year
- Understand which pipelines or managers show the strongest seasonal variation
- Use historical patterns to set realistic targets and plan resources
- Identify which quarters consistently outperform others
- Plan marketing and sales activity around historically strong periods
- Compare seasonal patterns between pipelines or responsible managers
- Support annual forecasting with data-backed seasonality analysis
The dashboard connects to Bitrix24 deal data filtered by close date. Sixteen visualizations cover revenue and deal volume by period, year-over-year seasonal comparisons, and breakdowns by pipeline and responsible manager. Filters: Period (by close date), Pipeline, Responsible person.
FAQ
- We set the same sales targets every month but suspect performance is actually seasonal. How do we confirm that?
- We had a bad quarter and aren't sure whether it's a real problem or just a seasonal dip that happens every year. How do I check?
- We want to plan sales activity and staffing around peak periods but don't have historical data in one place. Where do I get it?
- What is needed to connect to Bitrix24?
Versión 3 · 03.07.2026
Historial

Historial de versiones
Versión 3
bug fixes
03.07.2026
Versión 2
bug fixes
13.01.2026


